|
From: 2001-Jun-30 00:00:00.000 |
|
| Power Measurement |
To: 1998-Jul-31 00:00:00.000 |
| Reporting
technology provided by |
|
| Number of Incidents | 9 | |
| Incident Interval | 20 seconds | |
| Number of disturbances | 9 | |
 |
||
| Worst Disturbances | ||||||
| Incident | Meter | Time |
Type
|
Phase
|
Duration(s)
|
Magnitude(%)
|
| Incident 9 | PML_DEMO_1.the7700ION | 2001-Feb-24 05:54:19.090 |
Sag
|
V2
|
1.33E-01
|
86.00
|
| Incident 1 | PML_DEMO_1.the7700ION | 2001-Mar-30 16:55:12.022 |
Sag
|
V3
|
5.00E-02
|
82.00
|
| Incident 8 | PML_DEMO_1.the7700ION | 2001-Mar-23 09:20:30.505 |
Sag
|
V2
|
1.60E-02
|
86.00
|
| Incident 7 | PML_DEMO_1.the7700ION | 2001-Mar-21 06:12:53.196 |
Trans
|
V3
|
3.90E-04
|
152.00
|
| Incident 6 | PML_DEMO_1.the7700ION | 2001-Mar-21 06:12:07.039 |
Trans
|
V1
|
2.60E-04
|
131.00
|
| Incident 2 | PML_DEMO_1.the7700ION | 2001-Mar-07 11:19:22.297 |
Trans
|
V2
|
1.30E-04
|
126.00
|
| Incident 3 | PML_DEMO_1.the7700ION | 2001-Mar-08 19:55:00.826 |
Trans
|
V2
|
1.30E-04
|
126.00
|
| Incident 4 | PML_DEMO_1.the7700ION | 2001-Mar-17 12:52:30.038 |
Trans
|
V1
|
1.30E-04
|
126.00
|
| Incident 5 | PML_DEMO_1.the7700ION | 2001-Mar-20 19:44:28.824 |
Trans
|
V2
|
1.30E-04
|
126.00
|
Statistics |
||||||
| Incident | First TimeStamp | Incident Duration |
#Transients
|
#Sags
|
#Swells
|
|
| Incident 1 | 2001-Feb-30 16:55:12.022 | 0 seconds |
0
|
1
|
0
|
|
| Incident 2 | 2001-Mar-07 11:19:22.297 | 0 seconds |
1
|
0
|
0
|
|
| Incident 3 | 2001-Mar-08 19:55:00.826 | 0 seconds |
1
|
0
|
0
|
|
| Incident 4 | 2001-Mar-17 12:52:30.038 | 0 seconds |
1
|
0
|
0
|
|
| Incident 5 | 2001-Mar-20 19:44:28.824 | 0 seconds |
1
|
0
|
0
|
|
| Incident 6 | 2001-Mar-21 06:12:07.039 | 0 seconds |
1
|
0
|
0
|
|
| Incident 7 | 2001-Mar-21 06:12:53.196 | 0 seconds |
1
|
0
|
0
|
|
| Incident 8 | 2001-Mar-23 09:20:30.505 | 0 seconds |
0
|
1
|
0
|
|
| Incident 9 | 2001-Mar-24 05:54:19.090 | 0 seconds |
0
|
1
|
0
|
|
| Totals |
6
|
3
|
0
|
|
||
|
From: 2001-Feb-30 16:55:12.022 |
|
| Power Measurement |
To: 2001-Feb-30 16:55:12.022 |
| Reporting
technology provided by |
|

|
PML_DEMO_1.the7700ION - Sags, Swells & Transients |
||||
| TimeStamp | Type |
Phase
|
Duration(s)
|
Magnitude(% Nominal)
|
| 2001-Feb-30 16:55:12.022 | Sag |
V3
|
5.00E-02
|
82
|
|
|
||||
| Meter | Basic Config |
|
Transient Config
|
Sag/Swell Config
|
| PT1-PT2 | CT1-CT2 | NomSV |
|
Threshold
|
Sag Lim | Swell Lim
|
|
| PML_DEMO_1.the7700ION |
|
|
88 | 106
|
|
|
From: 2001-Mar-07 11:19:22.297 |
|
| Power Measurement |
To: 2001-Mar-07 11:19:22.297 |
| Reporting
technology provided by |
|

|
PML_DEMO_1.the7700ION - Sags, Swells & Transients |
||||
| TimeStamp |
Type
|
Phase
|
Duration(s)
|
Magnitude(% Nominal)
|
| 2001-Mar-07 11:19:22.297 |
Trans
|
V2
|
1.30E-04
|
126
|
|
Meter Configuration |
||||
| Meter |
Basic Config
|
|
Transient Config
|
Sag/Swell Config
|
|
PT1-PT2 | CT1-CT2 | NomSV |
|
Threshold
|
Sag Lim | Swell Lim
|
|
| PML_DEMO_1.the7700ION |
347 - 347 | 600 - 5 | 347
|
|
125
|
88 | 106
|
|
From: 2001-Mar-08 19:55:00.826 |
|
| Power Measurement |
To: 2001-Mar-08 19:55:00.826 |
| Reporting
technology provided by |
|
| PML_DEMO_1.the7700ION - Sags, Swells & Transients | ||||
| TimeStamp |
Type
|
Phase
|
Duration(s)
|
Magnitude(% Nominal)
|
| 2001-Mar-08 19:55:00.826 |
Trans
|
V2
|
1.30E-04
|
126
|
| Meter Configuration |
||||
| Meter |
Basic Config
|
|
Transient Config
|
Sag/Swell Config
|
|
PT1-PT2 | CT1-CT2 | NomSV
|
|
Threshold
|
Sag Lim | Swell Lim
|
|
| PML_DEMO_1.the7700ION |
347 - 347 | 600 - 5 | 347
|
|
125
|
|
|
From: 2001-Mar-17 12:52:30.038 |
|
| Power Measurement |
To: 2001-Mar-17 12:52:30.038 |
| Reporting
technology provided by |
|

| PML_DEMO_1.the7700ION - Sags, Swells & Transients | ||||
| TimeStamp |
Type
|
Phase
|
Duration(s)
|
Magnitude(% Nominal)
|
| 2001-Mar-17 12:52:30.038 |
Trans
|
V1
|
1.30E-04
|
126
|
| Meter Configuration |
||||
| Meter |
Basic Config
|
|
Transient Config
|
Sag/Swell Config
|
|
PT1-PT2 | CT1-CT2 | NomSV
|
|
Threshold
|
Sag Lim | Swell Lim
|
|
| PML_DEMO_1.the7700ION |
347 - 347 | 600 - 5 | 347
|
|
125
|
|
|
From: 2001-Mar-20 19:44:28.824 |
|
| Power Measurement |
To: 2001-Mar-20 19:44:28.824 |
| Reporting
technology provided by |
|

|
PML_DEMO_1.the7700ION - Sags, Swells & Transients |
||||
| TimeStamp |
Type
|
Phase
|
Duration(s)
|
Magnitude(% Nominal)
|
| 2001-Mar-20 19:44:28.824 |
Trans
|
V2
|
1.30E-04
|
126
|
|
Meter Configuration |
||||
| Meter |
Basic Config
|
|
Transient Config
|
Sag/Swell Config
|
|
PT1-PT2 | CT1-CT2 | NomSV
|
|
Threshold
|
Sag Lim | Swell Lim
|
|
| PML_DEMO_1.the7700ION |
347 - 347 | 600 - 5 | 347
|
|
125
|
|
|
From: 2001-Mar 06:12:07.039 |
|
| Power Measurement |
To: 2001-Mar 06:12:07.039 |
| Reporting
technology provided by |
|

|
PML_DEMO_1.the7700ION - Sags, Swells & Transients |
||||
| TimeStamp |
Type
|
Phase
|
Duration (s)
|
Magnitude (% Nominal)
|
| 2001-Mar-21 06:12:07.039 |
Trans
|
V1
|
2.60E-04
|
131
|
|
Meter Configuration |
||||
| Meter |
Basic Config
|
|
Transient Config
|
Sag/Swell Config
|
|
PT1-PT2 | CT1-CT2 | NomSV
|
|
Threshold
|
Sag Lim | Swell Lim
|
|
| PML_DEMO_1.the7700ION |
347 -
347 | 600 - 5 | 347
|
|
125
|
|
|
From: 2001-Mar-21 06:12:53.196 |
|
| Power Measurement |
To: 2001-Mar-21 06:12:53.196 |
| Reporting
technology provided by |
|

|
PML_DEMO_1.the7700ION - Sags, Swells & Transients |
||||
| TimeStamp |
Type
|
Phase
|
Duration (s)
|
Magnitude (% Nominal)
|
| 2001-Mar-21 06:12:53.196 |
Trans
|
V3
|
3.90E-04
|
152
|
|
Meter Configuration |
||||
| Meter |
Basic Config
|
|
Transient Config
|
Sag/Swell Config
|
|
PT1-PT2 | CT1-CT2 | NomSV
|
|
Threshold
|
Sag Lim | Swell Lim
|
|
| PML_DEMO_1.the7700ION |
347 -
347 | 600 - 5 | 347
|
|
125
|
|
|
From: 2001-Mar-23 09:20:30.505 |
|
| Power Measurement |
To: 2001-Mar-23 09:20:30.505 |
| Reporting
technology provided by |
|

|
PML_DEMO_1.the7700ION - Sags, Swells & Transients |
||||
| TimeStamp |
Type
|
Phase
|
Duration (s)
|
Magnitude (% Nominal)
|
| 2001-Mar-23 09:20:30.505 |
Sag
|
V2
|
1.60E-02
|
86
|
|
Meter Configuration |
||||
| Meter |
Basic Config
|
|
Transient Config
|
Sag/Swell Config
|
|
PT1-PT2 | CT1-CT2 | NomSV
|
|
Threshold
|
Sag Lim | Swell Lim
|
|
| PML_DEMO_1.the7700ION |
|
|
125
|
88 | 106
|
|
From: 2001-Mar-24 05:54:19.090 |
|
| Power Measurement |
To: 2001-Mar-24 05:54:19.090 |
| Reporting
technology provided by |
|
|
PML_DEMO_1.the7700ION - Sags, Swells & Transients |
||||
| TimeStamp |
Type
|
Phase
|
Duration (s)
|
Magnitude (% Nominal)
|
| 2001-Mar-24 05:54:19.090 |
Sag
|
V2
|
0.133000001
|
86
|
|
Meter Configuration |
||||
| Meter |
Basic Config
|
|
Transient Config
|
Sag/Swell Config
|
|
PT1-PT2 | CT1-CT2 | NomSV
|
|
Threshold
|
Sag Lim | Swell Lim
|
|
| PML_DEMO_1.the7700ION |
|
|
|
88 | 106
|
|
|
|
| Power Measurement |
|
| Reporting
technology provided by |
|
| Power Quality |
| A major concern about disturances in power quality is the adverse effect sags and swells can have on electrical equipment. The severity of a sag or a swell in voltage is determined by a combination of how large it was and how long it lasted. |
| Reported Values |
| Only the worst phase is recorded and plotted for each disturbance. The worst value is calculated by multiplying the magnitude and the duration. For example, if one disturbance has the same duration of 1 second for all phases, but a magnitude of 103% on the phase V1 and a magnitude of 100% on phase V2, then the phase V1 data will be reported. |
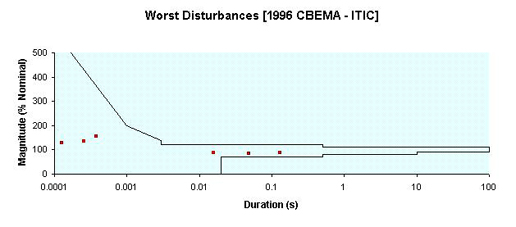
| Worst Disturbances |
| On each incident sheet, the worst disturbance is highlighted in red, bold italics. This is also the disturbance that is recorded on the Summary Sheet. The worst disturbance is defined as the disturbance with the largest severity. Severity is is defined (|100 - (% of nominal magnitude)|)* duration. |
| Grouping by incident: |
| This report was generated using incidents grouped by a user specified duration. This collection style attempts to group all disturbances associated with a single power system occurance. For example, a single event might trigger several disturbances. Thus, the collection of all disturbances within a given duration can aid in determining related events without distorting the quality of the power. |
| Suggested Duration |
| The IEEE Std. 1159-1995 definition of the minimum length of a sustained interruption is one minute. |
| Power Tolerance Curves |
| The power tolerance curve that is used with this report is the 1996 CBEMA (Computer Business Equipment Manufacturers Association) curve. |
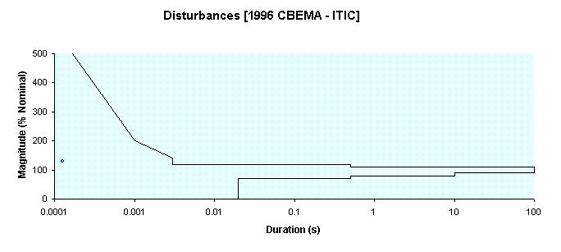
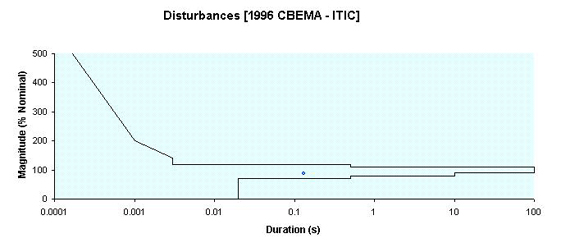
| The CBEMA curve |
| The CBEMA curve plots the magnitude of the disturbance (in percentage) on the Y-axis and the duration of the disturbance on the X-axis. Disturbances that fall within the envelope defined by the upper and the lower curve are typically not harmful to electical equipment;disturbances that fall outside the envelope may disrupt or damage the equipment. |
| Plotted Values |
| Disturbances for this report are divided into five categories: 1. Disturbances which fall between the upper and lower violation curves. These are graphed as disturbances. 2. Violations that lie above the upper violation curve. These are graphed as Upper Violations. 3. Violations that lie above the upper violation curve. These are graphed as Upper Violations. 4. Violations that cannot be graphed because the points are greater than the bounds of the graph. These are flagged as Violations but are not graphed. 5. Violations that cannot be graphed because the points are less than the bounds of the graph. These are not flagged as violations nor are they graphed. |
| Meter Configuration |
| Each Incident Sheet has its own information about the
meter configuration for the disturbances that are contained on its sheet.
There are three sections of meter configuration information which are: 1. Meter Information - This information is contained on the transient data sheets, so will only be displayed if transient information is available for the current meter. This section contains the timestamp of the disturbance where the information was gathered from,and the set-up values for the PT primary, PT secondary, CT primary, CT secondary and the Nominal System Volts. 2. Transient Configuration - This sectioncontains the timestamp of the disturbance where the information was gathered from,and the set-up values for the threshold which specifies how much the voltage can deviate from normal before the transient is recorded. 3. Sag/Swell Configuration - This sectioncontains the timestamp of the disturbance where the information and the set-up values was gathered from, for the sag limit and the swell limit which specify the limit the voltage must exceed/fall below to trigger the DistState register. |
| Definition of Terms |
| Disturbance: |
| An electromagnetic phenomena that results in one or more reports from the power monitor. |
| Incident: |
| A collection of disturbances grouped together by some duration |
| Data Sheets |
| The data sheets are supplied by Report Generator. These data sheets require a heading for each column of data. Missing columns that are used by this macro will default to 0. |